Friday, June 12, 2015

Voltage trends at Little Cayman, 2013-present

This post is expected to be the last of a series of posts to share the results of my recent evaluation of data produced by all of the CREWS/CCCCC buoys over their lifetimes, from 2013 to the present.  This post will briefly discuss the curious downward trend over time in voltage minima that is common to all three operational buoys.

This trend was first remarked upon in an email conversation between myself and Matt Previte of YSI on January 7th and 8th, 2015.  We had had occasion to examine the voltage levels at the Little Cayman (CCMI2) buoy because on December 29th, 2014 it had suffered a complete loss of power.  Subsequent to discovering that power failure I posted an analysis of 2014 voltage levels for CCMI2 with particular attention to the final month of data.  In this post I remarked:
Note the unexplained, slow downward trend of low voltages throughout the year.  This is not obviously related to the final loss of power but it is still curious.
Matt's email to me on January 7th touched upon that subject very briefly:
I'm also surprised by the gradual, overall decline in min/max of the daily battery voltage. I'll ask around to see if anyone else has thoughts on that. It wasn't below operational levels and batteries due wear, but seemed a little odd.
My own January 8th reply to this remark included the following:
I'm pretty sure I've seen similar patterns at (some of?) the other buoys, but I will have to let you know next week if I can back up that statement with real data. [...] I agree that the gradual low-voltages decline is mildly worrying without being hugely alarming.
In fact I did not follow up on this subject as promised until now, since I've just spent several weeks looking at trends in all of the CREWS/CCCCC data, and indeed the gradually-declining trend of voltage minima appears in the data from all three operational buoys.

For this post, we examine the voltage trends at Little Cayman, Cayman Islands (CCMI2).  Voltages are sampled every five seconds and then at 10-minute intervals the minimum voltage from the last ten minutes is reported.  This graph shows voltage minima reported by the Met datalogger (green) and the Main datalogger (red) as well as their difference (in blue, equal to Met - Main).  The first two parameters are graphed on the left axis and the third on the right, with both axes sharing the same scale but offset from one another by 11V.

Please click on this image to see it in larger form.

The most notable features of this graph are as follows: an obvious dip in voltage from October 14th - 29th while the station was on land for maintenance; a loss of data during the period from December 29th, 2014 until March 12th, 2015, caused by the station's power loss and subsequent redeployment; and an unexplained voltage dip at the end of the dataset beginning June 1st, 2015.  Data for this analysis were last refreshed on June 9th, 2015.

At this station the Met voltages were slightly lower than the Main voltages (by 0.057V on average) so my subsequent analysis of battery minima focuses on the Met voltages.

My informal analysis looked for the 'lower edges' of the minima to try to quantify how much they were decreasing over time and how quickly.  This is a largely subjective evaluation.  For CCMI2, this 'lower edge' was about 12.79V at deployment time.  This edge crept lower still by about 0.1V every 3-6 months until the power failure on December 29th, 2014, at which point (apart from obvious power irregularities) I estimate this lower edge to have been at about 12.52V, for a loss of about 0.33V overall.  Following redeployment this trend appears to have reversed itself somewhat, with a lower edge at about 12.60V for a short-term gain of about 0.08V.

Similar analyses were carried out for this buoy's sister stations at Buccoo Reef, Tobago (BUTO1) and at Speyside / Angel's Reef, Tobago (ARTO1).  Two of the stations (BUTO1, ARTO1) reported lower Main voltages on average and one (CCMI2) reported lower Met voltages.  All three stations exhibited a gradual downward trend in voltage minima, losing on average 0.1V every 4-8 months, with some slight changes in pace noted (decelerating at BUTO1, accelerating at ARTO1, constant at CCMI2).  There was also one reversal of this trend noted at CCMI2 following that station's power loss and redeployment in early 2015.

The complete analyses for the other voltage minima, including graphs, may be found at this link for BUTO1 and at this link for ARTO1.

(signed)
Mike Jankulak

Junction Box Humidities at Little Cayman, 2013-present

This post is part of a series of posts to share the results of my recent evaluation of data produced by all of the CREWS/CCCCC buoys over their lifetimes, from 2013 to the present.  This post will discuss the diagnostic relative humidity (RH) data collected from inside two of the buoy's junction boxes: the 'Main' and 'Met' junction boxes which house the Main and Met dataloggers, respectively.  Overly high humidities within either of these junction boxes could lead to a failure of the buoy's controlling electronics and lengthy interruptions in the data stream.

By way of example please see this post from the Little Cayman station log (including photos), which concludes that a "catastrophic power loss" was caused by "condensation" within the "solar panel junction box."  To my knowledge there are no diagnostic RH sensors deployed in the solar panel junction boxes at any CREWS/CCCCC station but this serves as an important lesson about the damage that moisture incursion can have on station operations.  In this case the Cayman station was nonoperational for 73 days and when redeployed it was found that communications with the WXT (Vaisala's 'Weather Transmitter') had failed, which may indicate another yet-undiagnosed effect of junction box condensation at that buoy.

The following graph shows the Little Cayman (CCMI2) diagnostic RH values plotted over the buoy's deployment lifetime to date (through June 9th, 2015).  The red line is RH maxima as measured within the Main junction box and the green line is RH maxima as measured within the Met junction box.

Please click on this image to see it in larger form.

Some obvious features of the above graph are as follows: initial buoy deployment was on October 23rd, 2013; the Main RH levels (red) ceased to fall below 20% on November 16th, 2013; there is a nine-month period when Main RH levels (red) remain strictly above 60% (January 17th - October 27th, 2014); there is a break in data lasting from the station's power failure (December 29th, 2014) until redeployment (March 12th, 2015); and there is a two-week period (April 30th - May 14th, 2015) during which there were no Met RH updates (green) because the Met logger's program stopped running (a situation believed to have been caused by excessive watchdog errors, indicating a potential programming/timing problem).  Note that the station's annual maintenance operations took place October 14th - 29th, 2014, throughout which RH data continued to be collected.

Note that these data report only the maximum RH seen in a ten-minute period of those raw values collected every five seconds.

A natural question is how humid is too humid?  I have heard it suggested that these junction box humidity maxima should not exceed 20%, and the lifetime of Met junction box RH data from the Buccoo Reef, Tobago CREWS/CCCCC buoy shows that this is an entirely attainable goal and can be regarded as a reasonable target.  However, at what point should overly-high RH values prompt remedial intervention?  I have for many years run CREWS programming tests inside my office which has had the side-effect of collecting a long-term dataset of indoor RH values, in an environment that is dry enough to prevent any damage from moisture or condensation.  Based on these somewhat accidental datasets I would suggest that RH values up to 50% may be considered tolerable, but that prolonged measurements of diagnostic humidity in excess of 50% should be considered cause for immediate reparative action.

The story told by these data, then, is twofold:  the Met junction box (green line) begins nicely stable and largely below 10% for about six months, a pattern which starts to be disrupted on April 10th, 2014.  On June 6th, 2014 the pattern shifts significantly above 10% for the first time, and this increasing pattern becomes quite obvious on August 7th, 2014, which is the last Met RH report to fall below 10%.  This only becomes worrisome on October 29th, 2014, the date of buoy redeployment after its annual maintenance operations, which also happens to be the Met RH's last report to fall below the 20% humidity threshold.  Met RH values remain in the worrisome-but-not-alarming range (above 20% but below 50%) from October of 2014 to May of 2015, but following the two-week period of non-updates of Met RH data (i.e. beginning May 14th, 2015, see above) Met RH values are well into the >50% alarming range, with 97.2% of Met RH reports rising above 50% humidity.  In the final 6 days of data examined in this report, in fact, all of the Met RH reports are above 90% humidity.

The Main RH numbers for this station are even more concerning.  These numbers started low but spiked quickly.  Less than one month after initial deployment the Main RH numbers rose above 20% and never recovered, beginning November 16th, 2013.  Two months after that, on January 17th, 2014, the Main RH numbers rose above 60% humidity and remained there until the buoy's annual maintenance operations nine months later in October.  Following those operations Main RH levels dropped slightly but remained at >50% humidity for 97.2% of the time.

These diagnostics indicate that there are presently serious humidity problems in both of the Main and Met junction boxes at this site, with the Main junction box problems being pretty much constant over the lifetime of the buoy to date and the Met junction box problems starting slow but becoming very serious over the last few months.  Given that this is the site where junction box condensation was blamed for a very serious power failure, both of these humidity concerns should be attended to at the earliest possible opportunity.

Similar analyses have been conducted at this station's sister buoys located at Buccoo Reef, Tobago (BUTO1) and at Speyside / Angel's Reef, Tobago (ARTO1).  A pattern that is common to all three of these buoys is that the Main RH levels are all presently at alarming levels, after starting out acceptably low during initial deployment and increasing much more quickly than the Met RH levels do.  This might suggest a design or construction problem with the moisture seals on the Main junction box, or a lack of clear deployment instructions regarding proper sealing of the junction boxes and the use of fresh desiccant.

The Met RH patterns at the three buoys range from BUTO1, where Met RH levels start low and stay low throughout the buoy's entire lifetime, to ARTO1, showing a mildly-increasing trend of Met RH levels that is not yet any cause for alarm, to CCMI2, where Met RH levels began low but increased quickly and are presently at levels that are alarmingly high.  There does not seem to be any reason to suspect a systemic problem with the Met junction box design, construction, or deployment practices as there is in the case of the Main junction boxes.

The complete analyses for the other RH diagnostics, including graphs, may be found at this link for BUTO1 and at this link for ARTO1.

(signed)
Mike Jankulak

Thursday, June 11, 2015

WDirDiff/Compass data from Little Cayman, 2013-present

This post is part of a series of posts to share the results of my recent evaluation of data produced by all of the CREWS/CCCCC buoys over their lifetimes, from 2013 to the present.  This post will discuss the offsets (WDirDiffs) between the wind directions reported by the analog anemometer manufactured by RM Young (RMY) and the sonic wind sensors on Vaisala's Weather Transmitter (WXT).  Ideally these offsets should be less than 5° in absolute value.  This post will further discuss the raw directions reported by the buoy's Compass.

For reference, some important milestones in this station's lifetime are as follows:
  • 10/23/2013: initial deployment
  • 10/14/2014 - 10/29/2014: buoy brought to land for a maintenance operation
  • 12/29/2014 - 3/12/2015: station offline due to a power failure, brought to land before redeployment
  • 3/12/2015 - 6/9/2015 (present): station's WXT non-operational (no redundant wind data)
The following graph shows the differences in wind directions reported by the two wind sensors (red, on the left axis) and the raw directions reported by the compass (blue, on the right axis).  All directions are reported in degrees of compass but note where the scales are different by a factor of 6x and the zeroes offset, with the WDirDiff axis running on the left from -30° to +30° but the Compass axis running on the right from 0° to 360°.  A negative WDirDiff would indicate that the reported WXT wind directions are lower than the corresponding analog anemometer values.

Please click on this image to see it in larger form.

First of all the Compass averages suggest that this buoy has been deployed in the same orientation throughout its entire lifetime to date.  See the report of WDirDiff/Compass averages for the Buccoo Reef station for an example where this does not appear to be the case.

The second thing to note from this graph is that the WDirDiffs average through the end of 2014 (after which time WXT wind directions are not available for comparison) is +1.5°.  This is entirely reasonable and falls within a range explainable by the specifications of the anemometer (± 5° accuracy) and the WXT (± 3° accuracy).

Similar analyses carried out at this buoy's sister stations at Buccoo Reef, Tobago (BUTO1) and Speyside / Angel's Reef, Tobago (ARTO1) found that the BUTO1 Compass directions can be divided into four distinct "regimes" with subsequent regime averages offset from one another by roughly 180°, and the ARTO1 Compass directions were stable throughout its deployment lifetime to date.  At BUTO1 the lifetime WDirDiff average is -18.6° and at ARTO1 the lifetime WDirDiff average is -11.4°, which suggests that at both Tobago buoys the wind instruments may not be properly oriented with the divergence being more significant at BUTO1 compared to ARTO1.

The complete analyses for the other WDirDiff/Compass averages, including graphs, may be found at this link for BUTO1 and at this link for ARTO1.

(signed)
Mike Jankulak

Wednesday, June 10, 2015

AirT/RH performance at Little Cayman, 2013-present

This post is part of a planned series of posts to share the results of my recent evaluation of data produced by all of the CREWS/CCCCC buoys over their lifetimes, from 2013 to the present.  This post will discuss the performance of the analog instruments which measure air temperature (AirT) and relative humidity (RH).  These analog reading serve as a basis of comparison for AirT/RH measurements reported by the Vaisala Weather Transmitter (WXT) which also reports wind, barometric pressure and precipitation data.

At Little Cayman the analog AirT/RH sensor's first deployment lasted 226 days before both the AirT and RH data simultaneously went bad on June 6, 2014.  [All instruments on a CREWS/CCCCC buoy are intended to produce usable data for an entire year.]  The buoy was brought to land for an annual maintenance operation on October 14-29, 2014 and suffered a power loss on December 29, 2014 that was repaired on land before redeployment on March 12, 2015.  The AirT/RH appears to have been successfully repaired/replaced during the October 2014 operation and has produced reasonable data since then.  This amounts to 150 days of reasonable AirT/RH data and counting, or 223 days and counting if you assume that the sensor would have operated properly during the buoy's extended power outage.

Note that at the time of the buoy's March 2015 redeployment it was discovered that the WXT communications had failed, so as of this writing there are no redundant AirT or RH readings available to compare against the analog AirT/RH readings.

The following are graphs of AirT (top, in °C) and RH (bottom, in %) from the Little Cayman buoy's lifetime, from 2013 to the present.  Values reported from the analog sensor under discussion are in blue and values from the WXT are in red.  Data are shown through June 9, 2015.

Please click on this image to see it in larger form.

Based on this data record the CCMI2 (Little Cayman) buoy's AirT/RH sensor performed reasonably well for 376 days out of the buoy's 506 operational days, or about 74% of the time.  Its longest stretch of proper operation was 226 days, or about 7.4 months.

Similar analysis performed on this buoy's sister stations at Buccoo Reef, Tobago (BUTO1) and Speyside / Angel's Reef (ARTO1) found that the BUTO1 instrument performed reasonably well for 90 days out of the buoy's 469 operational days, or about 19% of the time, and the ARTO1 instrument performed reasonably well for 181 days out of the buoy's 557 operational days, or about 32% of the time.  The BUTO1 sensor's longest stretch of proper operation was 90 days, or about 3.0 months, and the ARTO1 sensor's longest stretch of proper operation was 181 days, or about 6.0 months.

The complete analyses for the other AirT/RH sensors, including graphs, may be found at this link for BUTO1 and at this link for ARTO1.

(signed)
Mike Jankulak

Friday, April 24, 2015

wxt failure, resumptions of data feeds

This is catch-up post about the state of things with the Little Cayman CREWS buoy, which we at CHAMP refer to informally as CCMI2 and is known to NDBC and the US National Weather Service as buoy #42089:

March 12th, 2015: judging from the way the compass directions settled down, the buoy was redeployed on site at about 2300 UTC.  This would have been at about 6pm local time on this Thursday evening.

March 31st, 2015: in catching up my data spreadsheets before preparing our CoRIS metadata submissions, I noticed that the buoy's WXT appear to be mostly uncommunicative.  The WXT is the instrument made by Vaisala that measures winds and rains (both acoustically) as well as air temperature and pressure and relative humidity.  The few measurements that did make it through appeared to agree with readings from the analog sensors, so this looks like primarily an issue of communications with the instrument.  In fact there are signs of WXT trouble dating back to last December so this problem may have developed concurrently with the corrosion that caused the December power outage, and may have more or less the same underlying cause (terminal corrosion).

At the same time I mentioned that the panel humidity diagnostic seems to be running high, in the 30% - 40% range, which may indicate an improper seal on that chamber or perhaps insufficient desiccant packs.

April 17th, 2015: I was reminded by Kristi Foster of CCMI that the data feeds had never been restarted from this buoy post-redeployment.  Rather than pass along the bad WXT data in our feeds I'd been waiting for word about a possible fix for the WXT problem.  In talking over the status again, Jon Clamp stated that the WXT issue would likely not be resolved before early June at the earliest, and that resolving that problem would probably involve recovering the buoy to land again for repair.  That being the case, I undertook to work around the WXT failure as much as possible and restart the data feeds.

April 24th, 2015: feeds of Cayman data have restarted to NDBC, the CHAMP database and CHAMP Portal, and CHAMP's G2 Ecoforecasting system.  NDBC often chooses to withold data from a new or long-silent station while they perform their own QA process, so our data may not appear on their site until next week.  The CHAMP Portal once again should be loading buoy data in near real-time, although fields sourced from the WXT will continue to be missing or (in some cases) corrupted.  Data loads into G2 have already resumed although this may have limited effect because there does not at this time seem to be any ecoforecasts defined in G2 for this site.

Some links:
(signed)
Mike Jankulak

Thursday, March 19, 2015

With the LC Crews Station being offline since December 29th 2014 and subsequently losing all power and ability to communicate it was decided that we would need to pull the buoy out and do a thorough investigation into the cause. Consequently the buoy was pulled on February 27th 2015.
               The problem was found at the first point of inspection and was due to a failure in the solar panel junction box whereby condensation had entered and corroded the connection terminals and diodes. This caused the catastrophic power loss.
                                          

A new terminal bar was installed along with new diodes which quickly had the buoy systems back up and running. Further comms tests and instrument tests were performed and it was found that our RF comms were inoperable. This issue has been identified solely to the receiving RF unit at the Little Cayman Research Center. Given that this is not a critical issue it was decided to leave the RF comms offline until a repair can be made at Campbell Scientific. The RF should be back up and running in the near future.
                 Upon confirming that the cellular telemetry was working and that NOAA was receiving our data once again it was decided to redeploy the buoy. This was achieved on March 12th 2015.


We are now using a converted boat trailer to make our deployments and retrievals somewhat easier.

Tuesday, January 6, 2015

ccmi2 buoy offline, power failure suspected

On January 5th I sent out a general email alert to LCRC, YSI, C-ARMS and NOAA personnel, noting that the Little Cayman CREWS buoy had gone offline on December 29th (at 21:25 UTC) and asking whether anyone had further information about what might be going on.

Laura Wright of LCRC replied that they still haven't fixed their RF (radio) connection to the buoy and were therefore unable to communicate with it in any way.  She did report that the buoy was still physically in place, though.

Matt reminded me that AOML had put certain firewall kludges in place to allow the buoy to call into our government servers.  This setup is somewhat volatile as it is based on our best guess about what range of IP addresses might possibly be assigned dynamically to the buoy's modem by LCRC's cellular provider.  [This buoy is different from the other CREWS buoys that communicate by cellular modem in that LCRC's cellular provider could not assign them a static IP address.]  I contacted AOML's security guru and he has confirmed that there is no incoming traffic from the buoy on any IP, either within or outside of the expected range.

Matt later was able to check their YSI server's connection to the buoy and report that they too were unable to connect to it.  He suggested that I review the most recent transmissions to look for evidence of a possible power failure.

I reported that yes, the last several days of transmissions before failure indicated that the buoy's power levels were dropping steadily with no sign of charging from its solar panels.  Here is a graph of power levels (plotted in Volts against day-of-year in 2014) for the year:

Click on this image to see a larger version.

Note the unexplained, slow downward trend of low voltages throughout the year.  This is not obviously related to the final loss of power but it is still curious.  The data gaps and very low voltages in October were related to the buoy's recovery to land, its redeployment, and the data black-out from a week in November when the main logger's clock was running five hours behind UTC.  Those data are archived but require further manual intervention before reintegration.

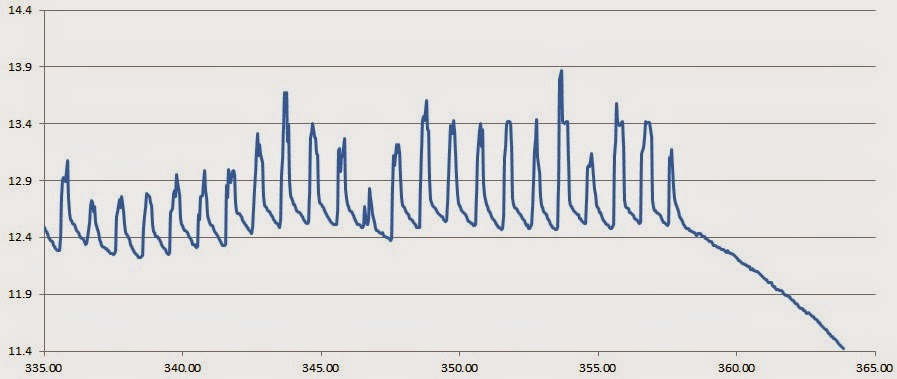
Here is a close-up of the power levels from only the last month before failure:

Click on this image to see a larger version.

Note that the buoy's normal diurnal pattern of daytime charging and nighttime power use was interrupted a bit more than five days before communications ceased, and thereafter there was only a slow but steady power drain.  I would also note that we have observed a handful of cases at other CREWS stations where an underwater instrument or cable has failed, and generally the resulting power drain is much quicker (in those cases the stations went offline within a few hours of the first sign of a power drain).

I also mentioned by email that the "panel humidity" diagnostic appeared to be trending high, both before and after October's annual maintenance operation.  I had thought this was a known issue, because I remembered seeing some email mention of it, but today when I looked for that mention all I could find was a December 8th email from Matt stating that the Barbados buoy's panel humidity was too high.  So perhaps there is an unnoticed/undiagnosed problem with the Cayman buoy's panel humidity, here seen in a percentage-vs.-day-of-year plot for all of 2014:

Click on this image to see a larger version.

Note that we have no reason to think the issue revealed by the panel humidity diagnostic, if there is one, is at all related to the loss of communications with the buoy.

Jon and Matt agree that the Low Voltage Disconnect has likely tripped, but that does not answer the question of what caused the power loss in the first place.  Possible causes include problems with the solar panels, batteries, regulator, or a short in one of the underwater cables or sensors, as speculated by Matt.

Laura reports that, weather permitting, the LCRC team is scheduled to visit the buoy next week, so we may learn more at that time.

(signed)
Mike Jankulak